-featured-1.jpg)
Measuring Impact
Determining the impact of an advertising campaign is hard.
Determining the impact when you don't have total control over who does and does not see an advertisement is even harder. That is precisely the case when working on Out Of Home (OOH) campaigns.
We're not talking about impressions, audiences, or CPM - all of those are useful and valuable on their own. We are talking about a verifiable impact on your business.
More clicks, more store visits, more purchases.
Our Case
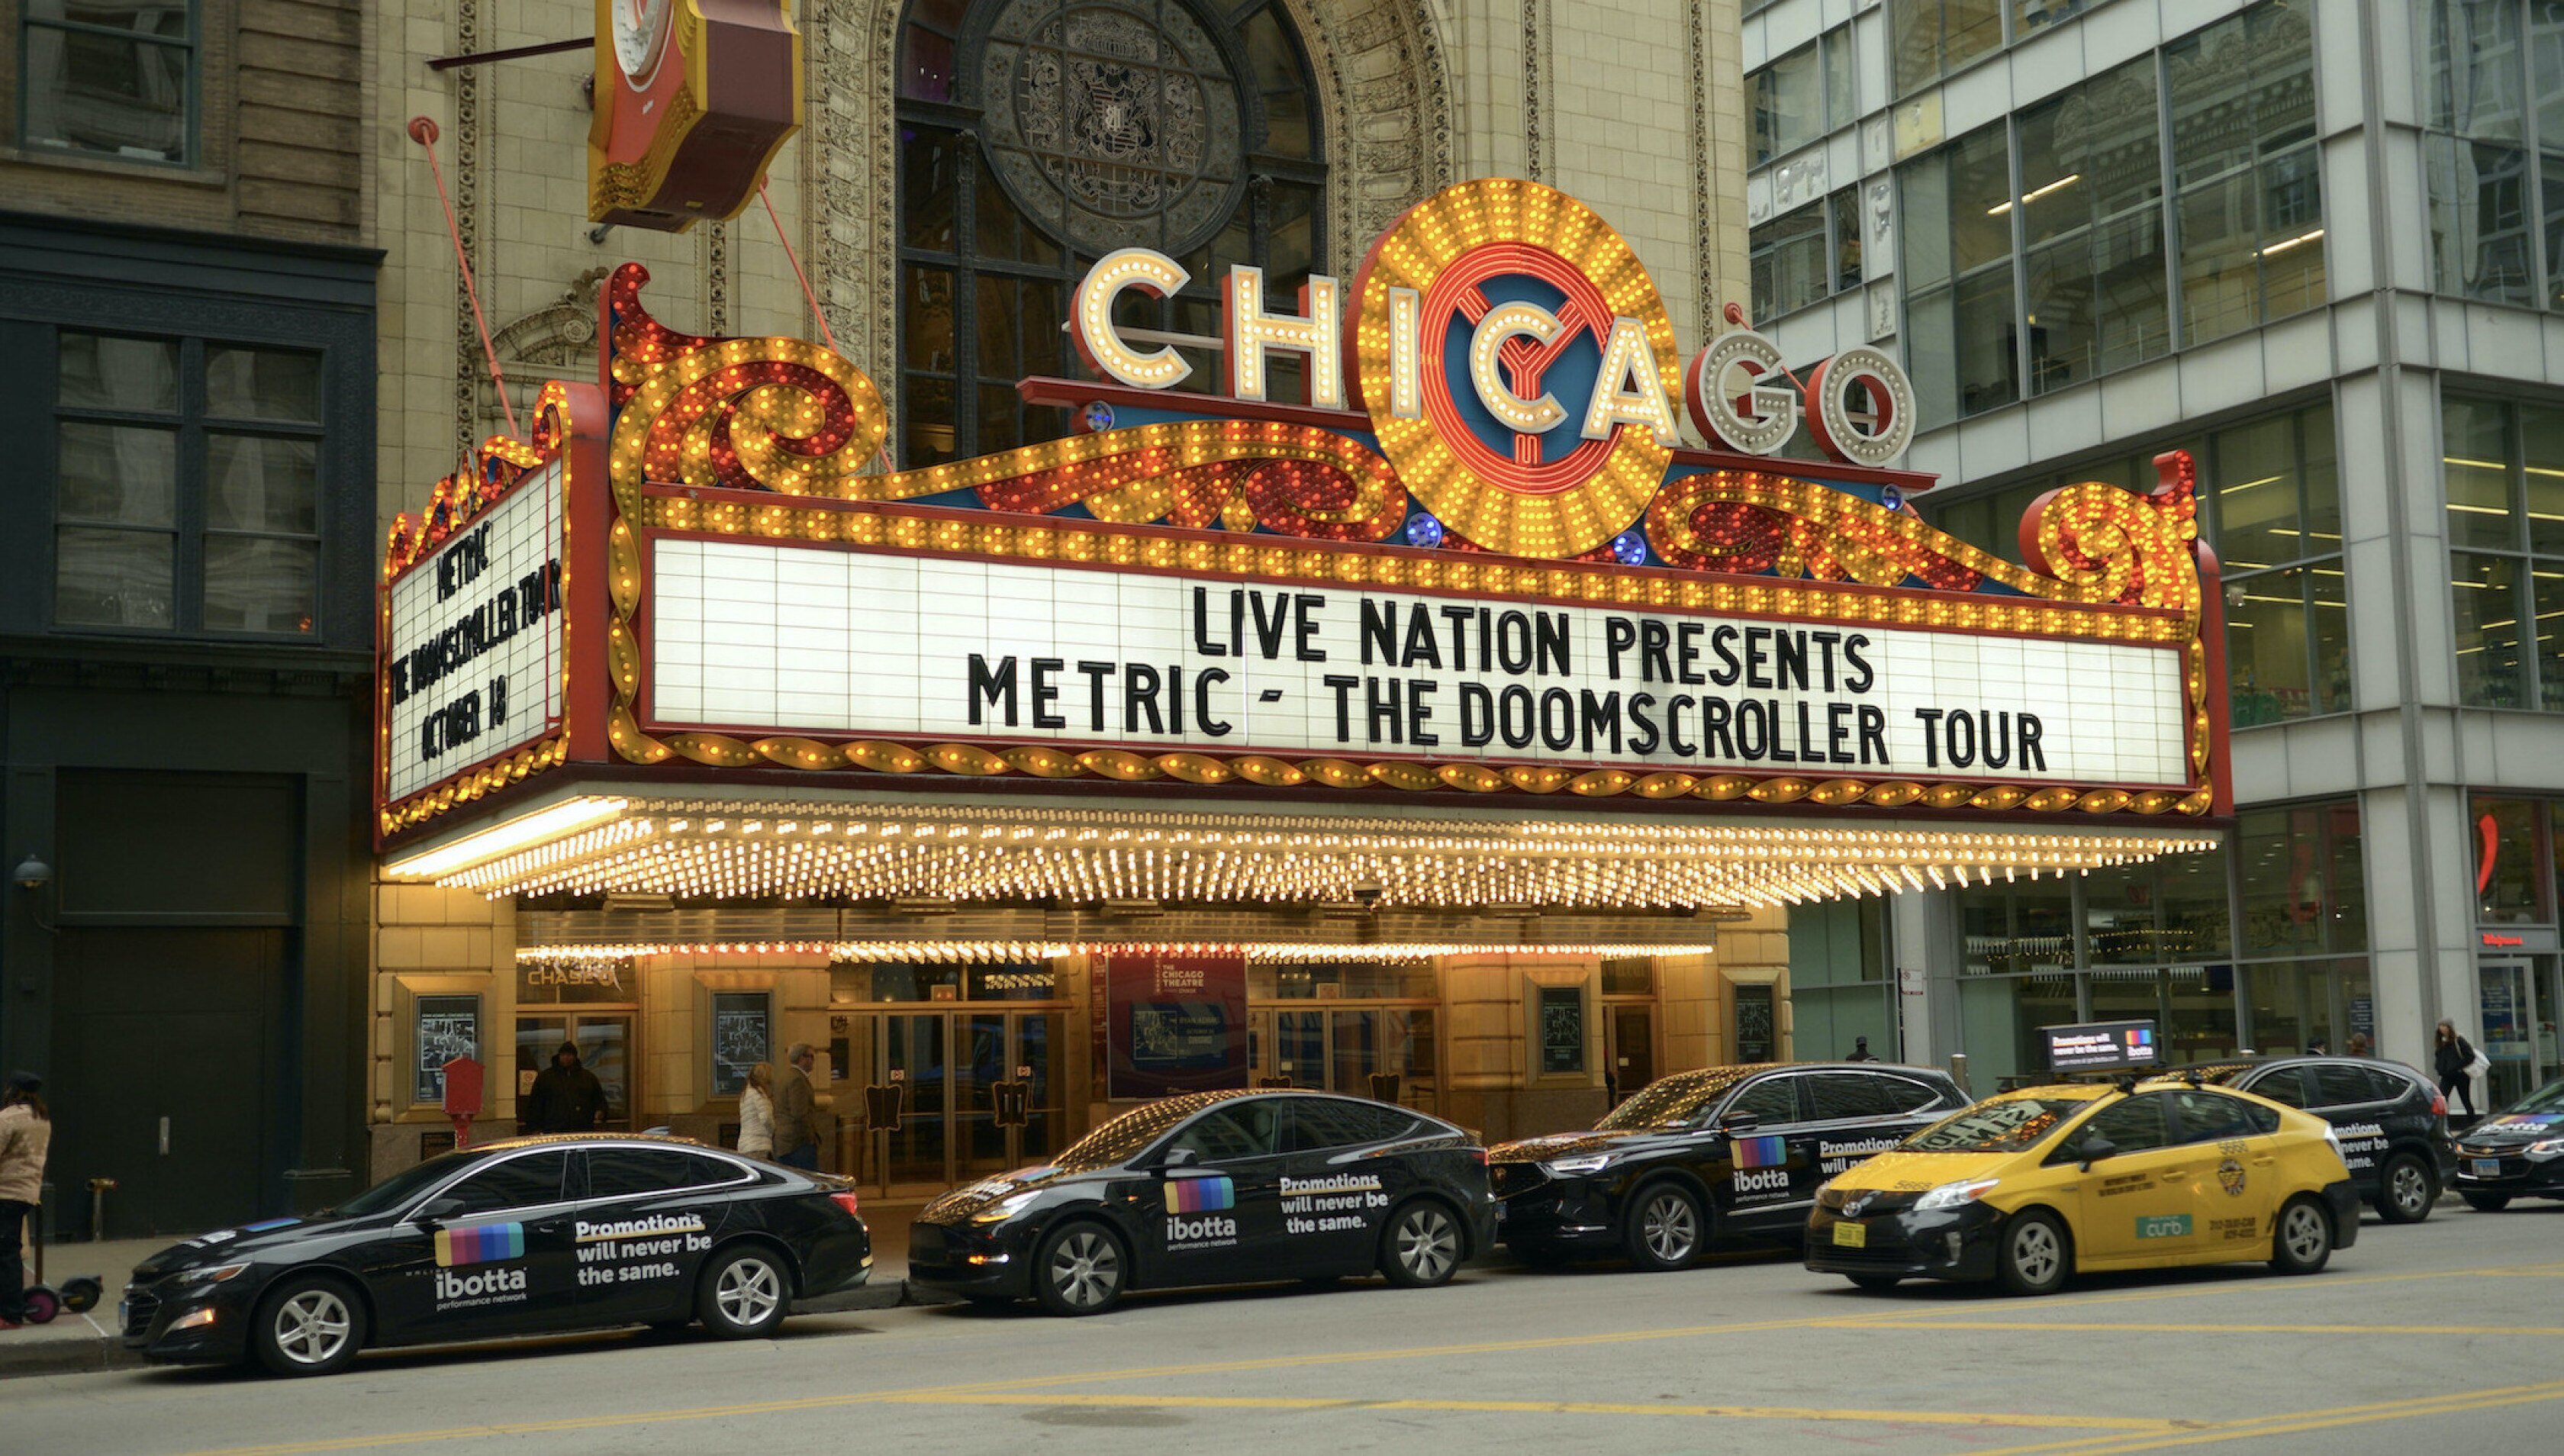
Our case is straightforward. We worked with a wireless telecommunications provider to help them reach their audience during the Superbowl. This involved 150 cars, and started a week before the Superbowl, continuing for 3 weeks afterward. We wanted to show how valuable our advertising is by proving out the impact of the campaign on the business.
On Random Selection
Most good studies start with two groups - an exposed group and an unexposed group. This allows a data scientist to compare how the exposed group behaves vs. how the unexposed group behaves. In simple terms, If you saw the advertisement, did you act differently? The key to doing this successfully is ensuring that the selection is random.
To understand what we mean by random, let's use an example. Say you've bought a set of billboards in Manhattan. You "expose" the majority of people working or living in Manhattan over a long period.
You could theoretically (and incorrectly) find an unexposed group by finding a set of people that work or live in New Jersey. This does not work because you have an inherent selection bias; the act of placing ads in a specific place means that you have selected a subset of the population to expose.
In the same way, if you have 150 vehicles driving around the city and have rented 150 billboards, you can't randomly assign people to see the ad. Furthermore, if you also have long-running tv and online advertising campaigns, how do you separate the value from the campaign you just started versus ones already running?
This is the question of causality.
Building A Baseline Model
The starting point of determining causality is establishing a baseline model. You want to find data that predicts the outcome you are trying to measure but which is not the outcome you are trying to measure. In our example, we are going to do a case study using store visits.
It turns out, the number of visits to a particular category of stores is reasonably consistent over time. We take this information, as well as other custom-built features, to model the number of visits to that store. Once the model is accurate enough, we can say that we have a baseline model.
So what do we do with that baseline model? We use it to simulate what happens in an environment where everything else is held constant. The number of visits to a particular store becomes a mathematical function. That function is made up of total visits to that category of stores, total visits to all stores, and several other proprietary features.
We focus on a metric we call "Share of Category." Because we are working with population-level statistics, the metric we look at is the percentage of visits to your store(s), vs. all visits to stores in your category.
Think of this as "Share of Voice" but for foot traffic.
A category could be Computer Hardware, Grocery, or Cafe. If your "Share of Category" is 5%, then 5% of all foot traffic in your category are to your stores.
To make things easier, we have already indexed the vast majority of companies, and they are ready to go into our system. In the majority of cases, there is minimal effort required by the client to allow us to directly measure business impact.
Calculating Daily Boosts in Visitation
The next step is to determine two things.
- Does the model perform accurately before my campaign starts, and;
- What are the point-effects (i.e., how is the daily visitation rate increasing during my campaign)
We can take this one step further and compare the sum of all point-effects before, during, and after the campaign. This is the most honest truth of whether the model performs as intended and, more importantly, whether the campaign generated store visits.
We see a significant uptick in visits through the campaign, which didn't exist before the campaign started and disappeared after the campaign ended. This gives us confidence that 1) Our model is working and 2) Our advertising is adding value! But, how representative or significant is this increase?
Accumulating Performance Gains
Each day we collect the gains in visitation rate from our 75,000 person population in this study in Atlanta. Keep in mind we are looking at billions of GPS data points and tens of millions of visits. Our sample size can never include the entire population, but it covers a large portion of the U.S.
Making Sense of The Data
Hopefully, you now have a good idea of what we are doing, but we haven't yet given a real hard determination of the success of the campaign.
In this specific campaign, we boosted store visits by +2.75%, with a 98.5% probability that this effect was due to the advertising campaign. As a result, we can conclude with confidence that the advertising campaign was indeed successful.
A similar process can be applied to directly measuring the effect of a campaign on website clicks, sales, or anything else of value to the business. In fact, we would love to work with you on just such an analysis.
If you are interested in learning how far your ad-spend goes, please get in touch. Calculating ROI on advertising is difficult but not impossible, and we'd love to work with you to quantify what you are getting back.
If you are interested to learn more, please get in touch!
Jesse Moore - Chief Technology Officer - jesse@mobilads.co