Since the launch of mobilads, I've learned a thing or two about the out-of-home (OOH) advertising industry.
I started the company by asking myself a question — why are brands allocating significant ad-spend to taxi-tops, but no one is providing ad space on Ubers? In NYC where I had been living for the past 4 years, Uber and Lyft had taken over the transportation industry. Why hadn’t the advertising industry followed suit?
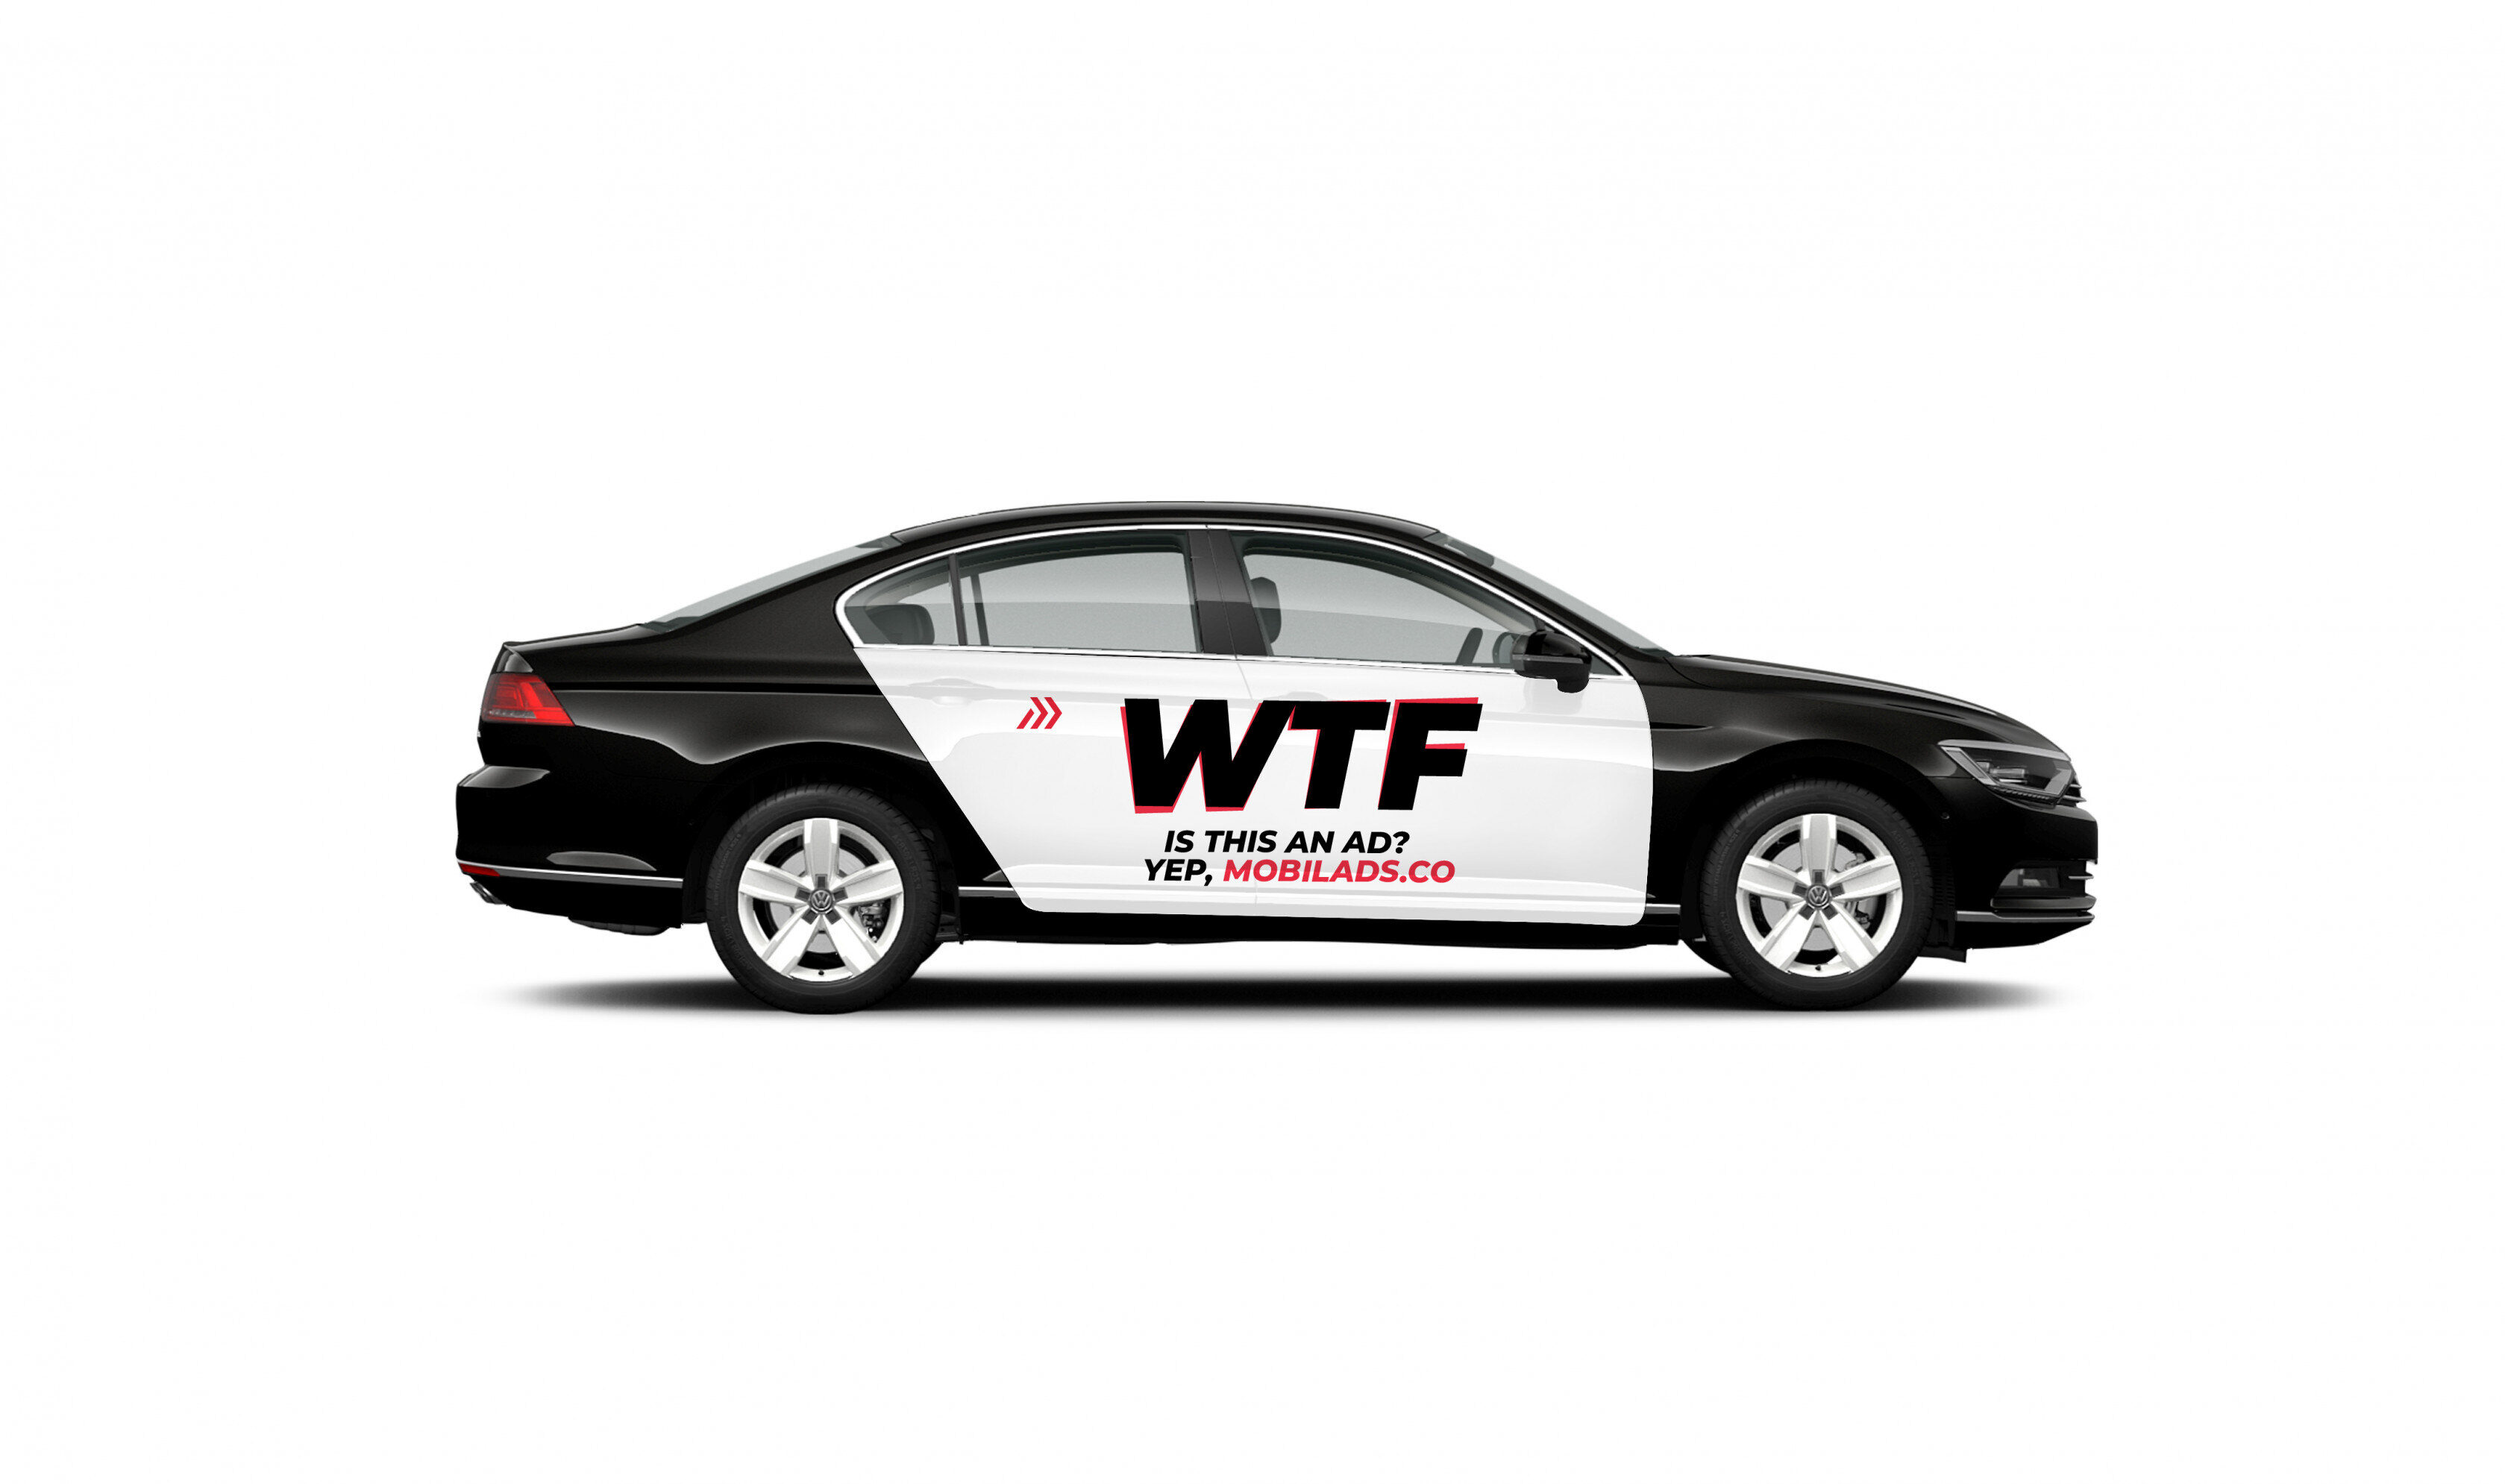
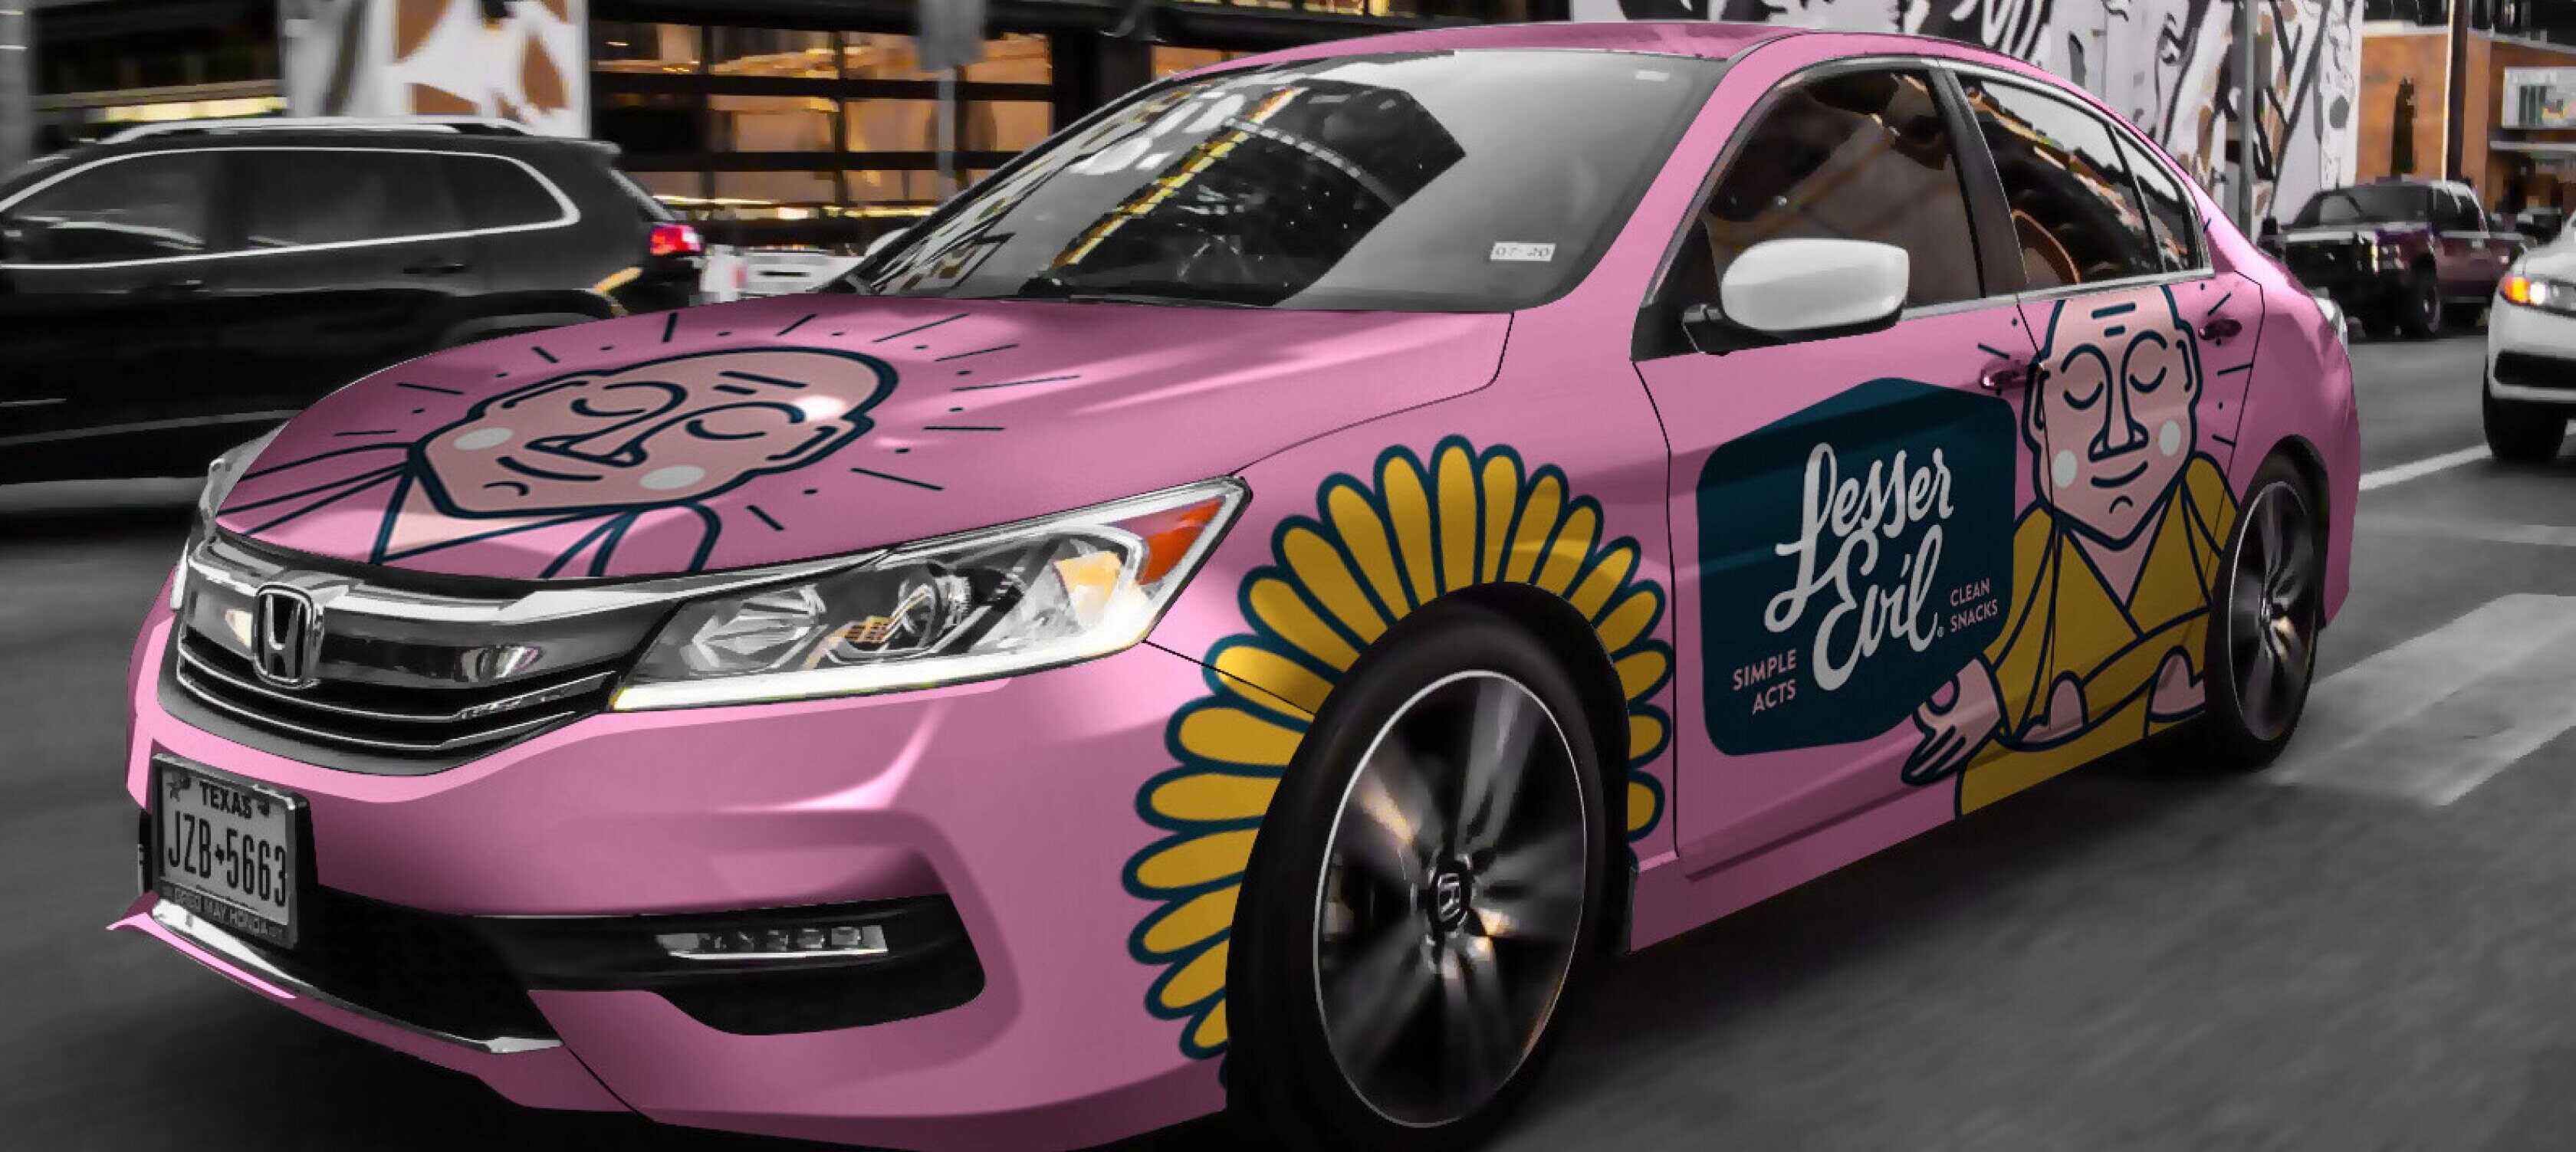
And so we launched mobilads; where we place ads on the exterior (and now interior) of rideshare vehicles. Brands love the medium, drivers love the extra income, passengers get access to cool offers… everyone wins.
To date, we've run campaigns for national advertisers such as Amazon, T-Mobile, and Boost Mobile.

The first thing we asked brands and agencies in initial meetings was “what keeps you coming back to taxi tops?” The answers we got were not specific… “we’ve always bought them”, “we like them”, “they’ve done well for us in the past”. It turns out, there wasn’t much data to back up the assumption that they were performing (they probably do — but they just didn’t have much proof). There was a lack of data that could be analyzed, compared, or trusted.
Seeing the lack of transparency and attribution in the space — we asked ourselves another question — if we wrap hundreds of rideshare vehicles in advertising across the US, can we prove the ads are working?
It wasn’t enough for us to provide an impressions estimate and back into CPM. We wanted to provide the full picture — all the way from the top of the funnel to the bottom.
Nowadays, we offer data analytics as part of our standard package — but in the beginning, we were searching for a way to measure the performance of our vehicles. Our approach was simple: 1 person = 1 device, and we can attribute performance utilizing web, app, and physical visits data from cell phone device IDs. We partner with companies to obtain this data — and use our proprietary geo-fencing algorithm to determine which devices have a high probability of viewing one of our wrapped vehicles.

In a recent campaign, we did all of the above. The results were pretty convincing. We cross-referenced GPS data from each of our vehicles with GPS data from devices within viewing distance of the creative, determining which devices to count as an impression.
We were able to generate an accurate impressions number for the entire campaign (and back into CPM), generate detailed demographic profiles of the audience, do online re-targeting of devices that were exposed, and track how many exposed devices ended up visiting a storefront (and how long it took for them to visit).

Not only did we generate millions of impressions — exposed devices were 2.7x more likely to click on a banner ad post-exposure than a random control group, and exposed devices were 2.5x more likely to visit a storefront than the unexposed. The ads were working — and the combination of OOH and re-targeting proved to be more effective when benchmarked against a generic search audience.
As we grow and learn, the accuracy of our measurement should improve. The more campaigns we do — the more data we’ll be able to incorporate into the machine learning on our backend. Nonetheless, we’re off to a good start — especially for an industry that hasn’t traditionally been able to provide much proof of performance (other than a few photos of the installations).
A detailed dashboard for the above-mentioned campaign can be found here. We generate a detailed campaign analysis in-house for each campaign that we launch.
I walked through this case study in a recent webinar hosted by Reveal Mobile. Here is a link to the PDF. Here's a link to the recording
Craig Cook - Chief Executive Officer - craig@mobilads.co

-featured-1.jpg)